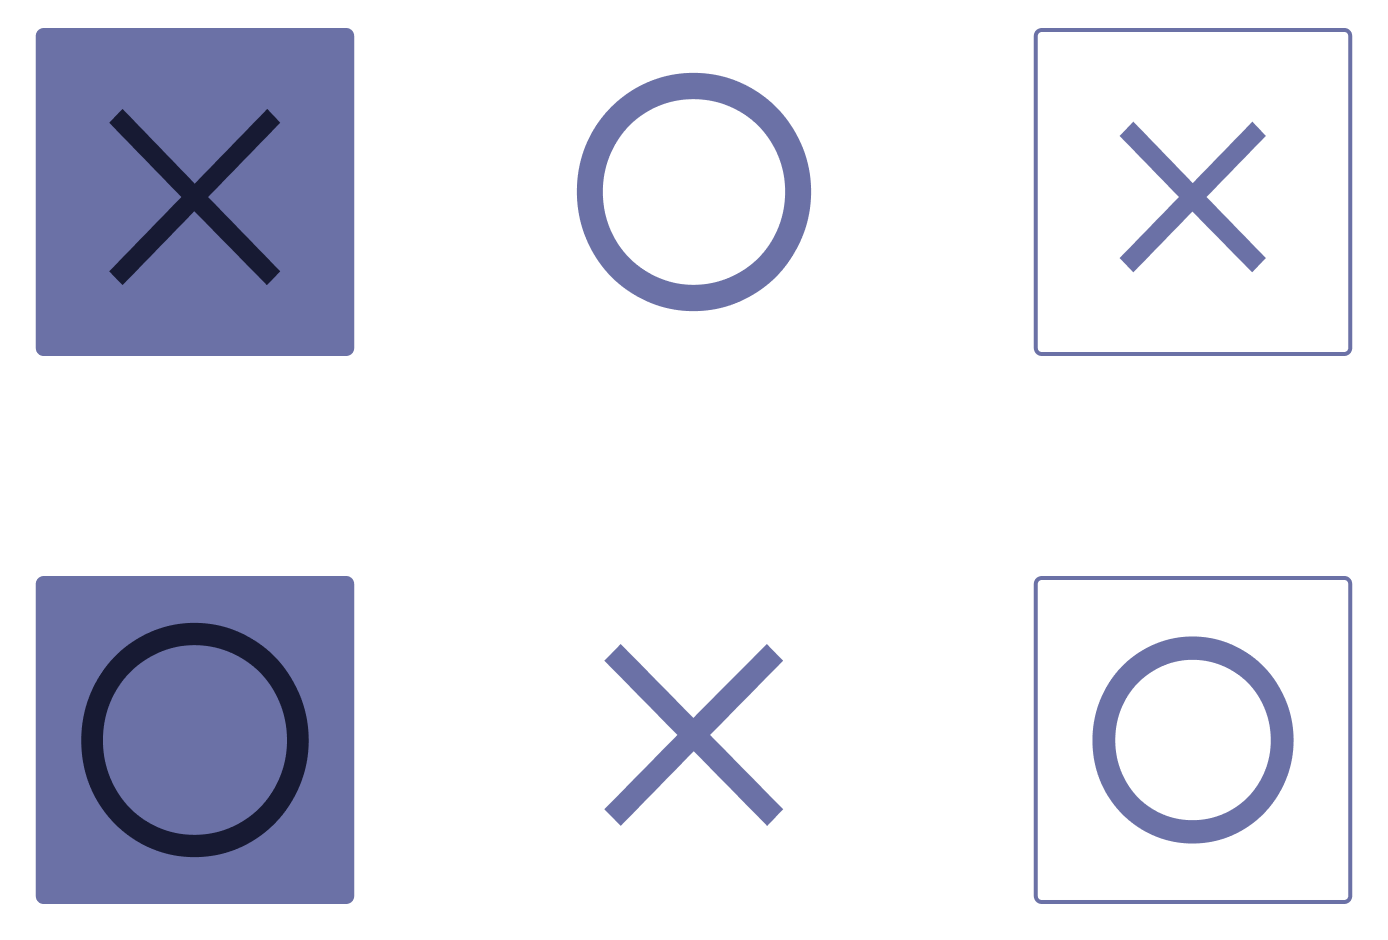
Symbology
Special values are indicated through consistent symbols & styles across charts.
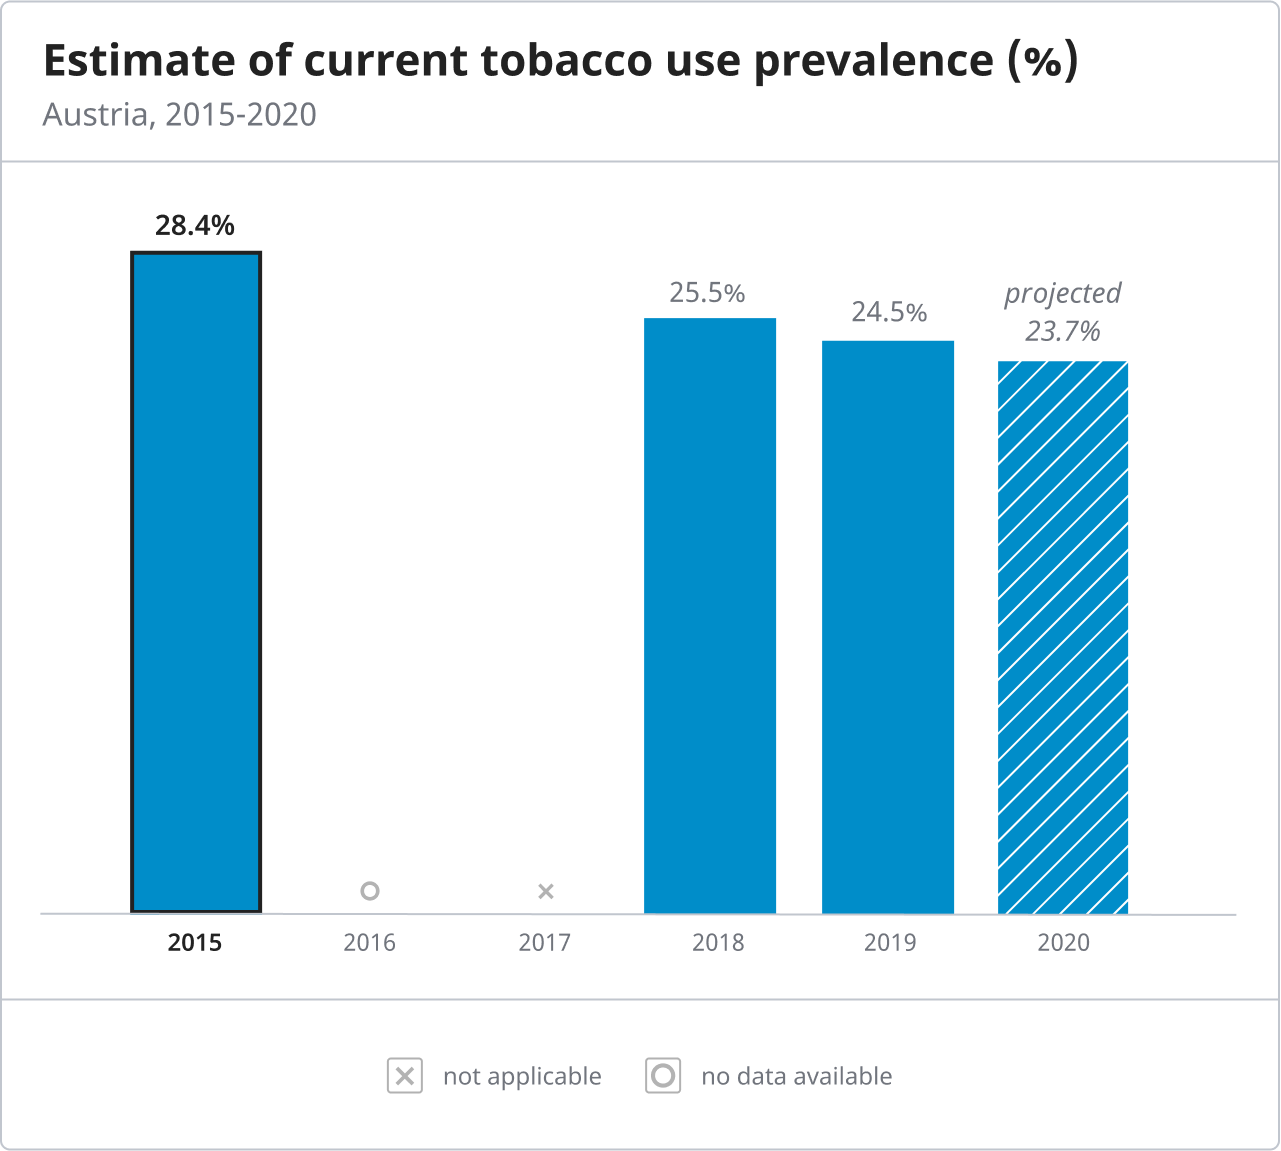
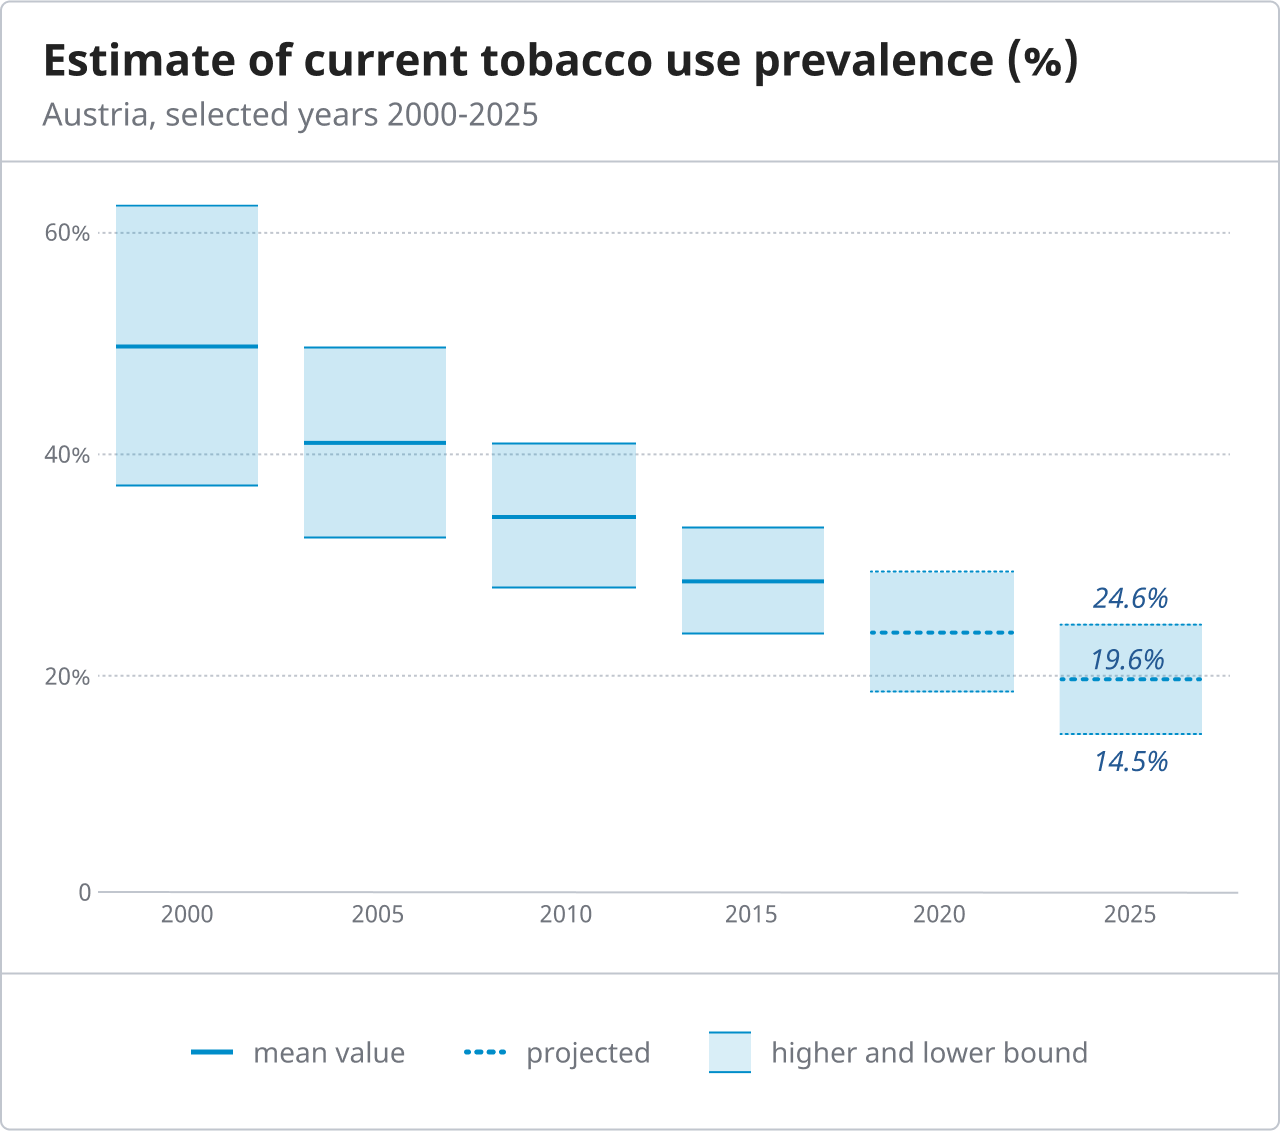
Projected Values
Projected values are indicated through hatching for filled areas and dashed lines. These styles can either be explained in a legend or through direct labeling. Data labels for projected values are shown in italics.
Uncertainty
For values with uncertainty, an area with lower opacity is drawn between upper & lower bound. Upper & lower bound are indicated through thinner lines. The mean is shown in the same ways as for reported/estimated values. In text, uncertainty is indicated in square brackets.
Data gaps
Data gaps should be labeled in charts using the same symbols. The symbols are be explained in legend.