Our data presentation provides a realistic, transparent view of data coverage, scope and precision.
Revealing uncertainty
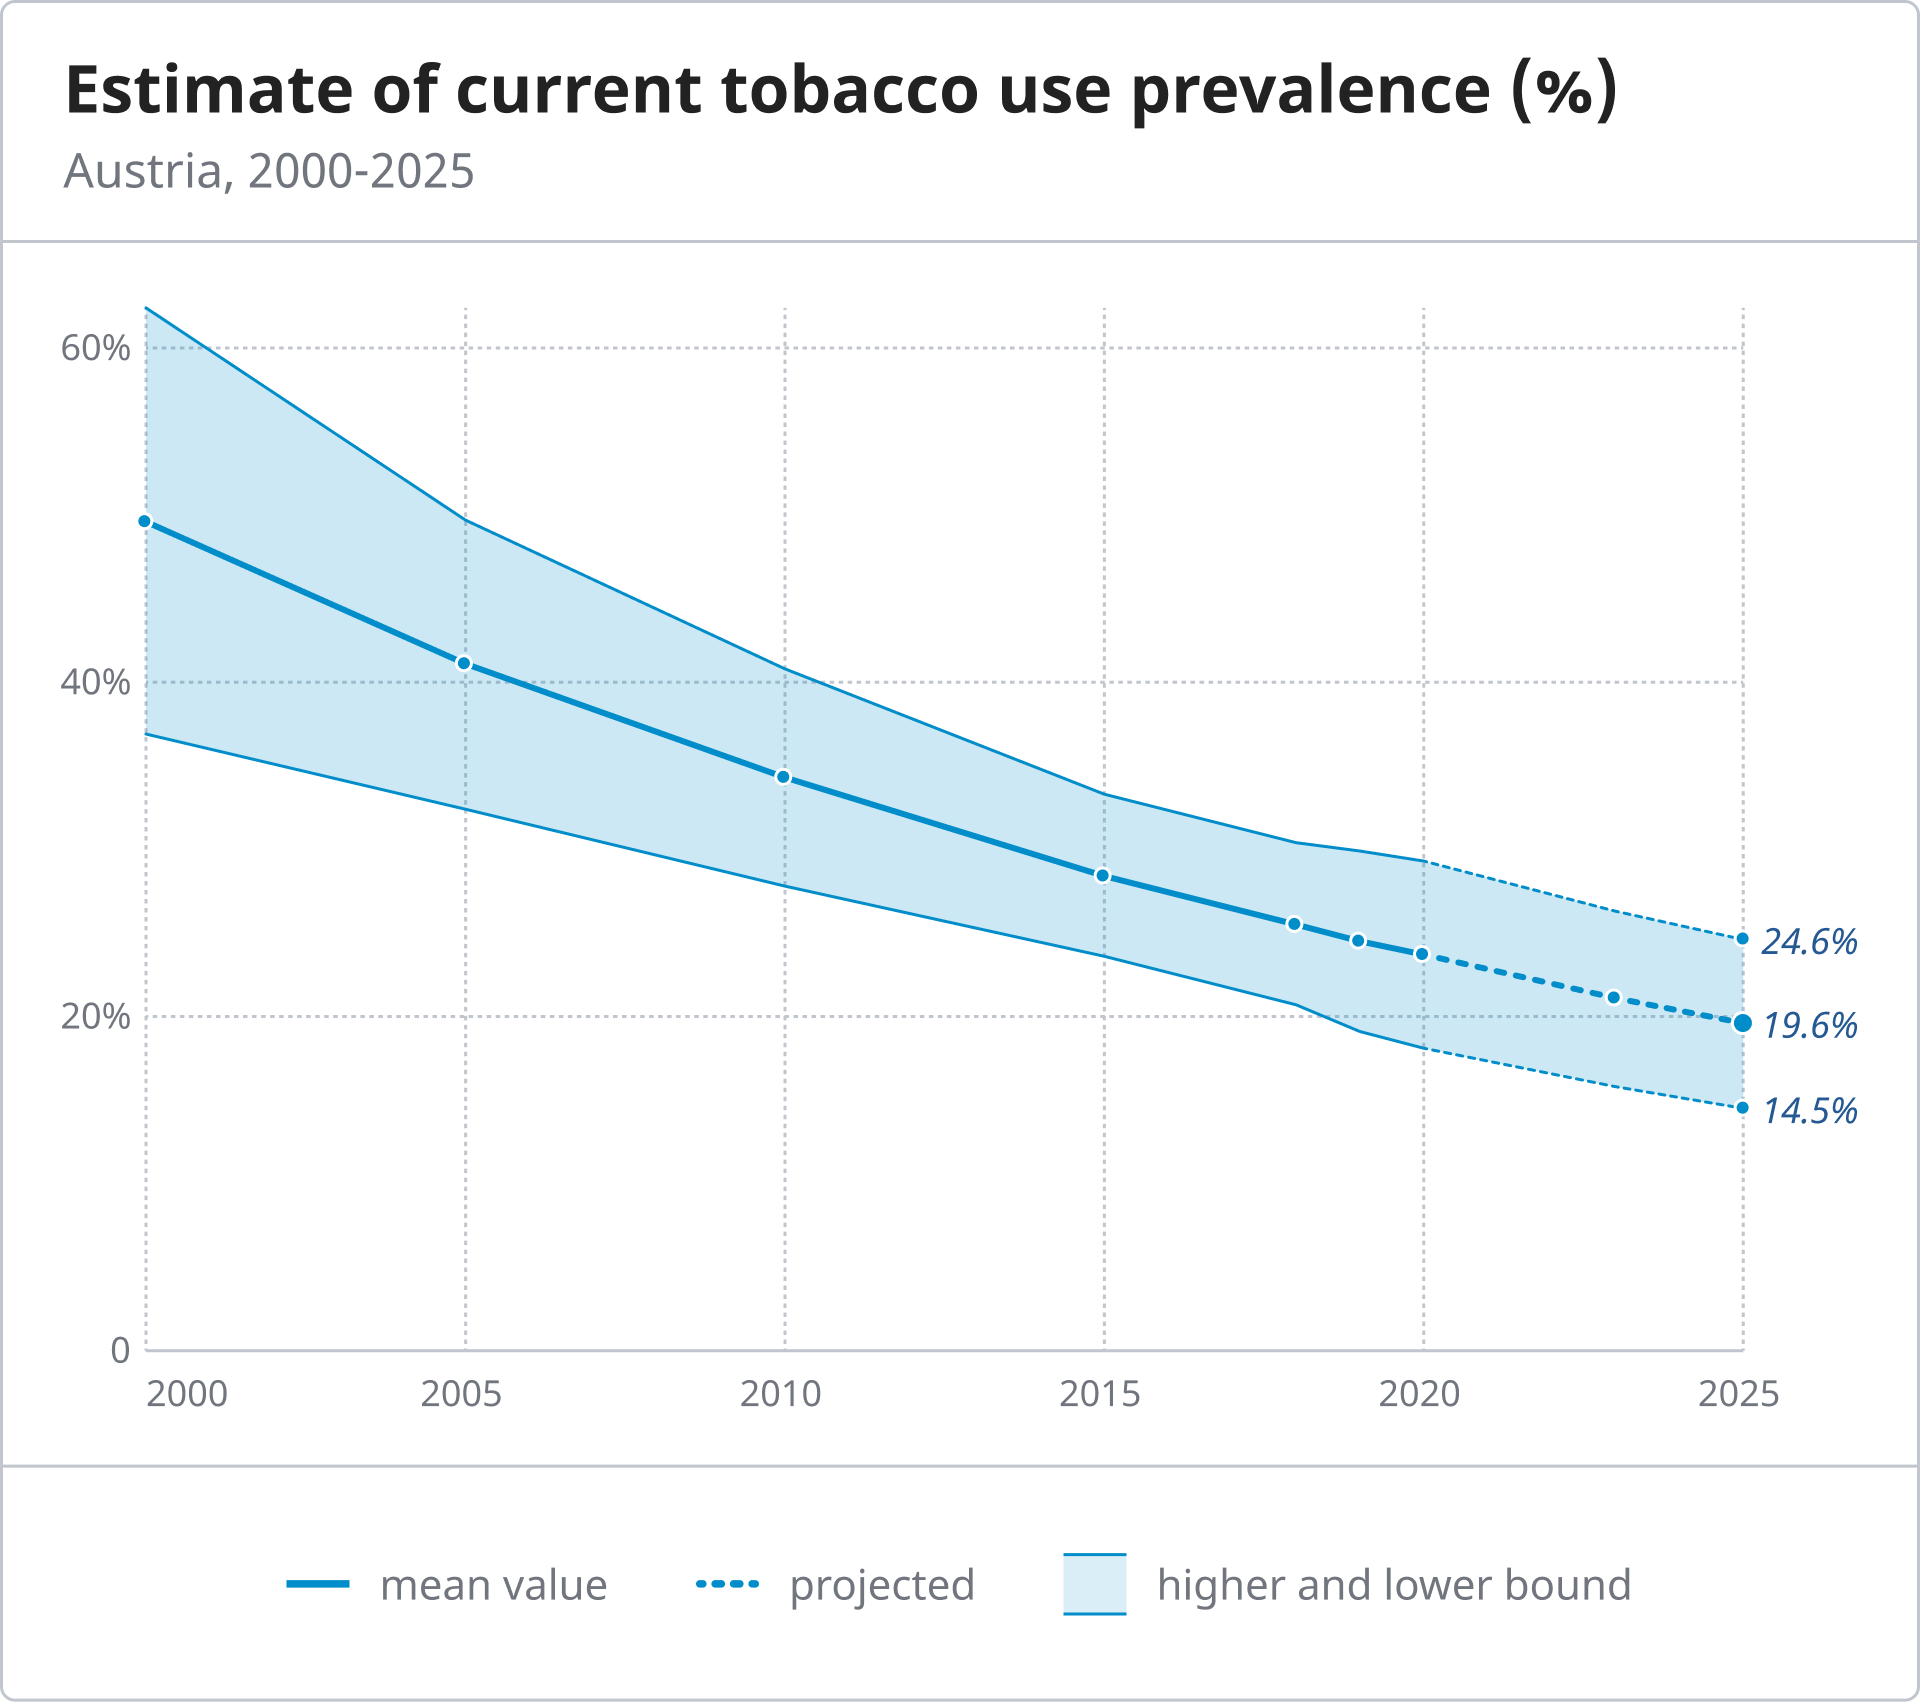
Visualizations allow to indicate the level of certainty of the data. This allows viewers to judge the confidence of insights that can be derived from the data.
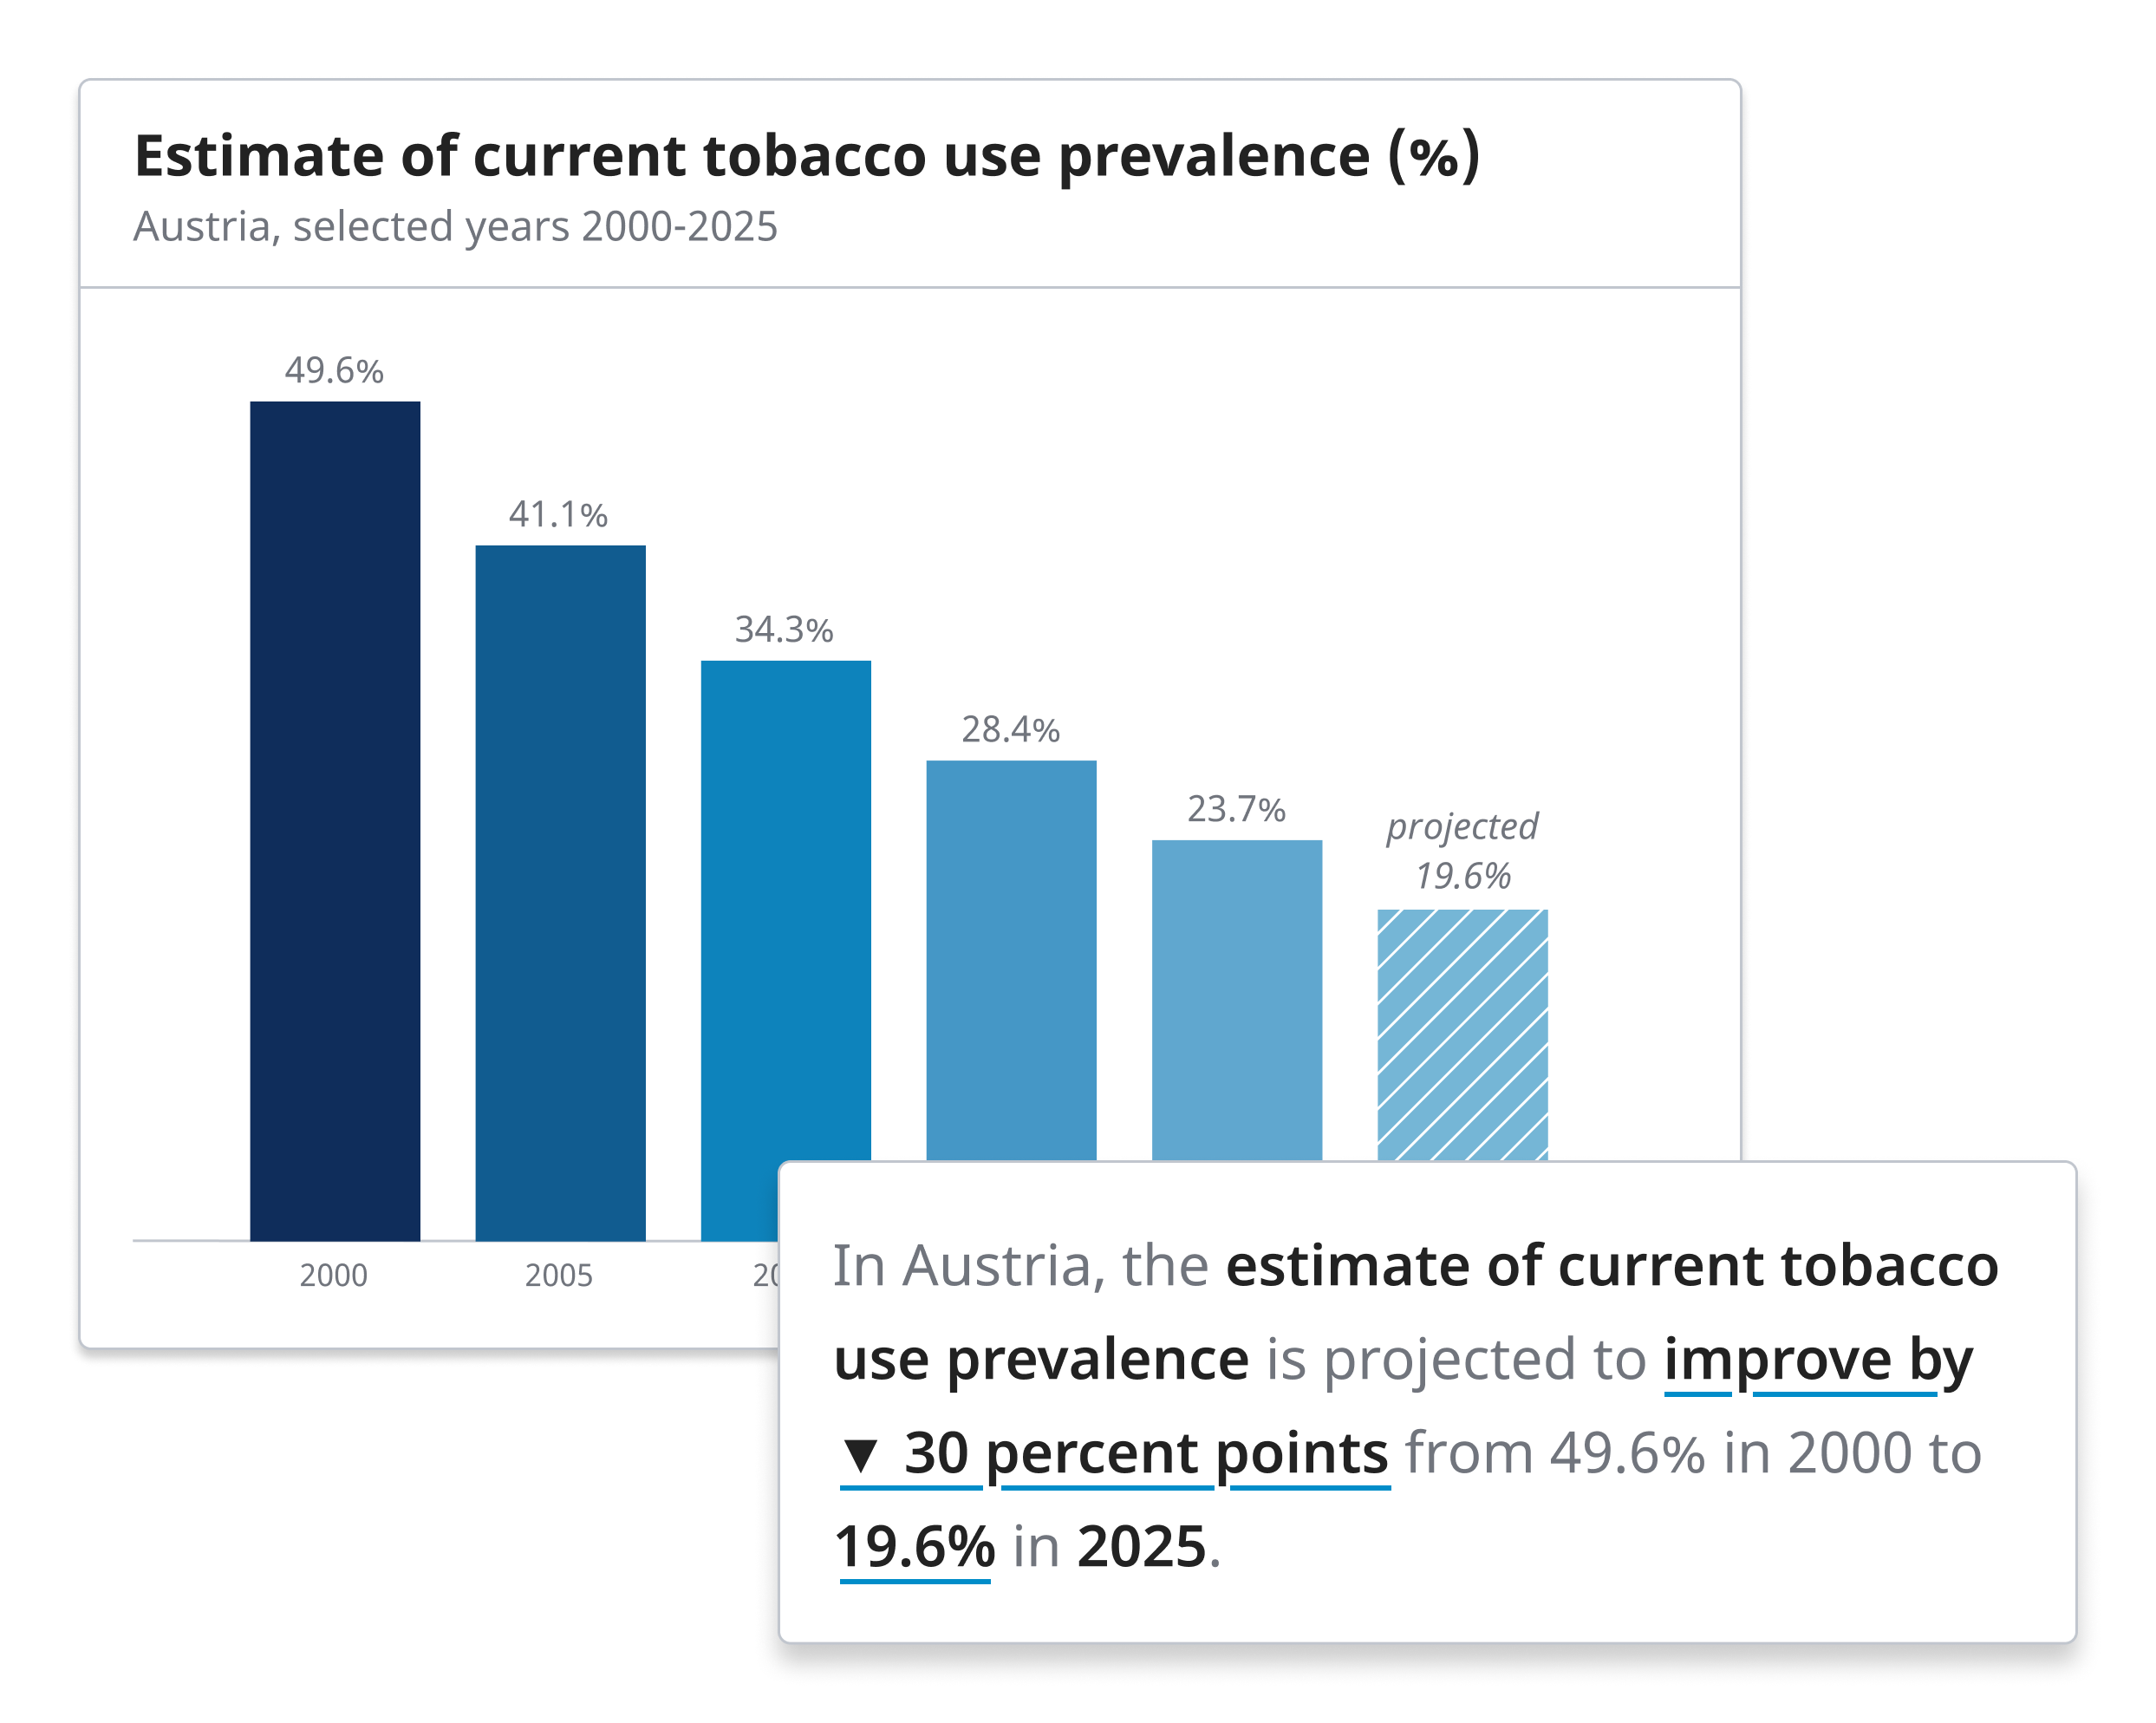
Indicating special values
Specific value types such as estimates, provisionals & projections are represented in a distinct & recognizable way.
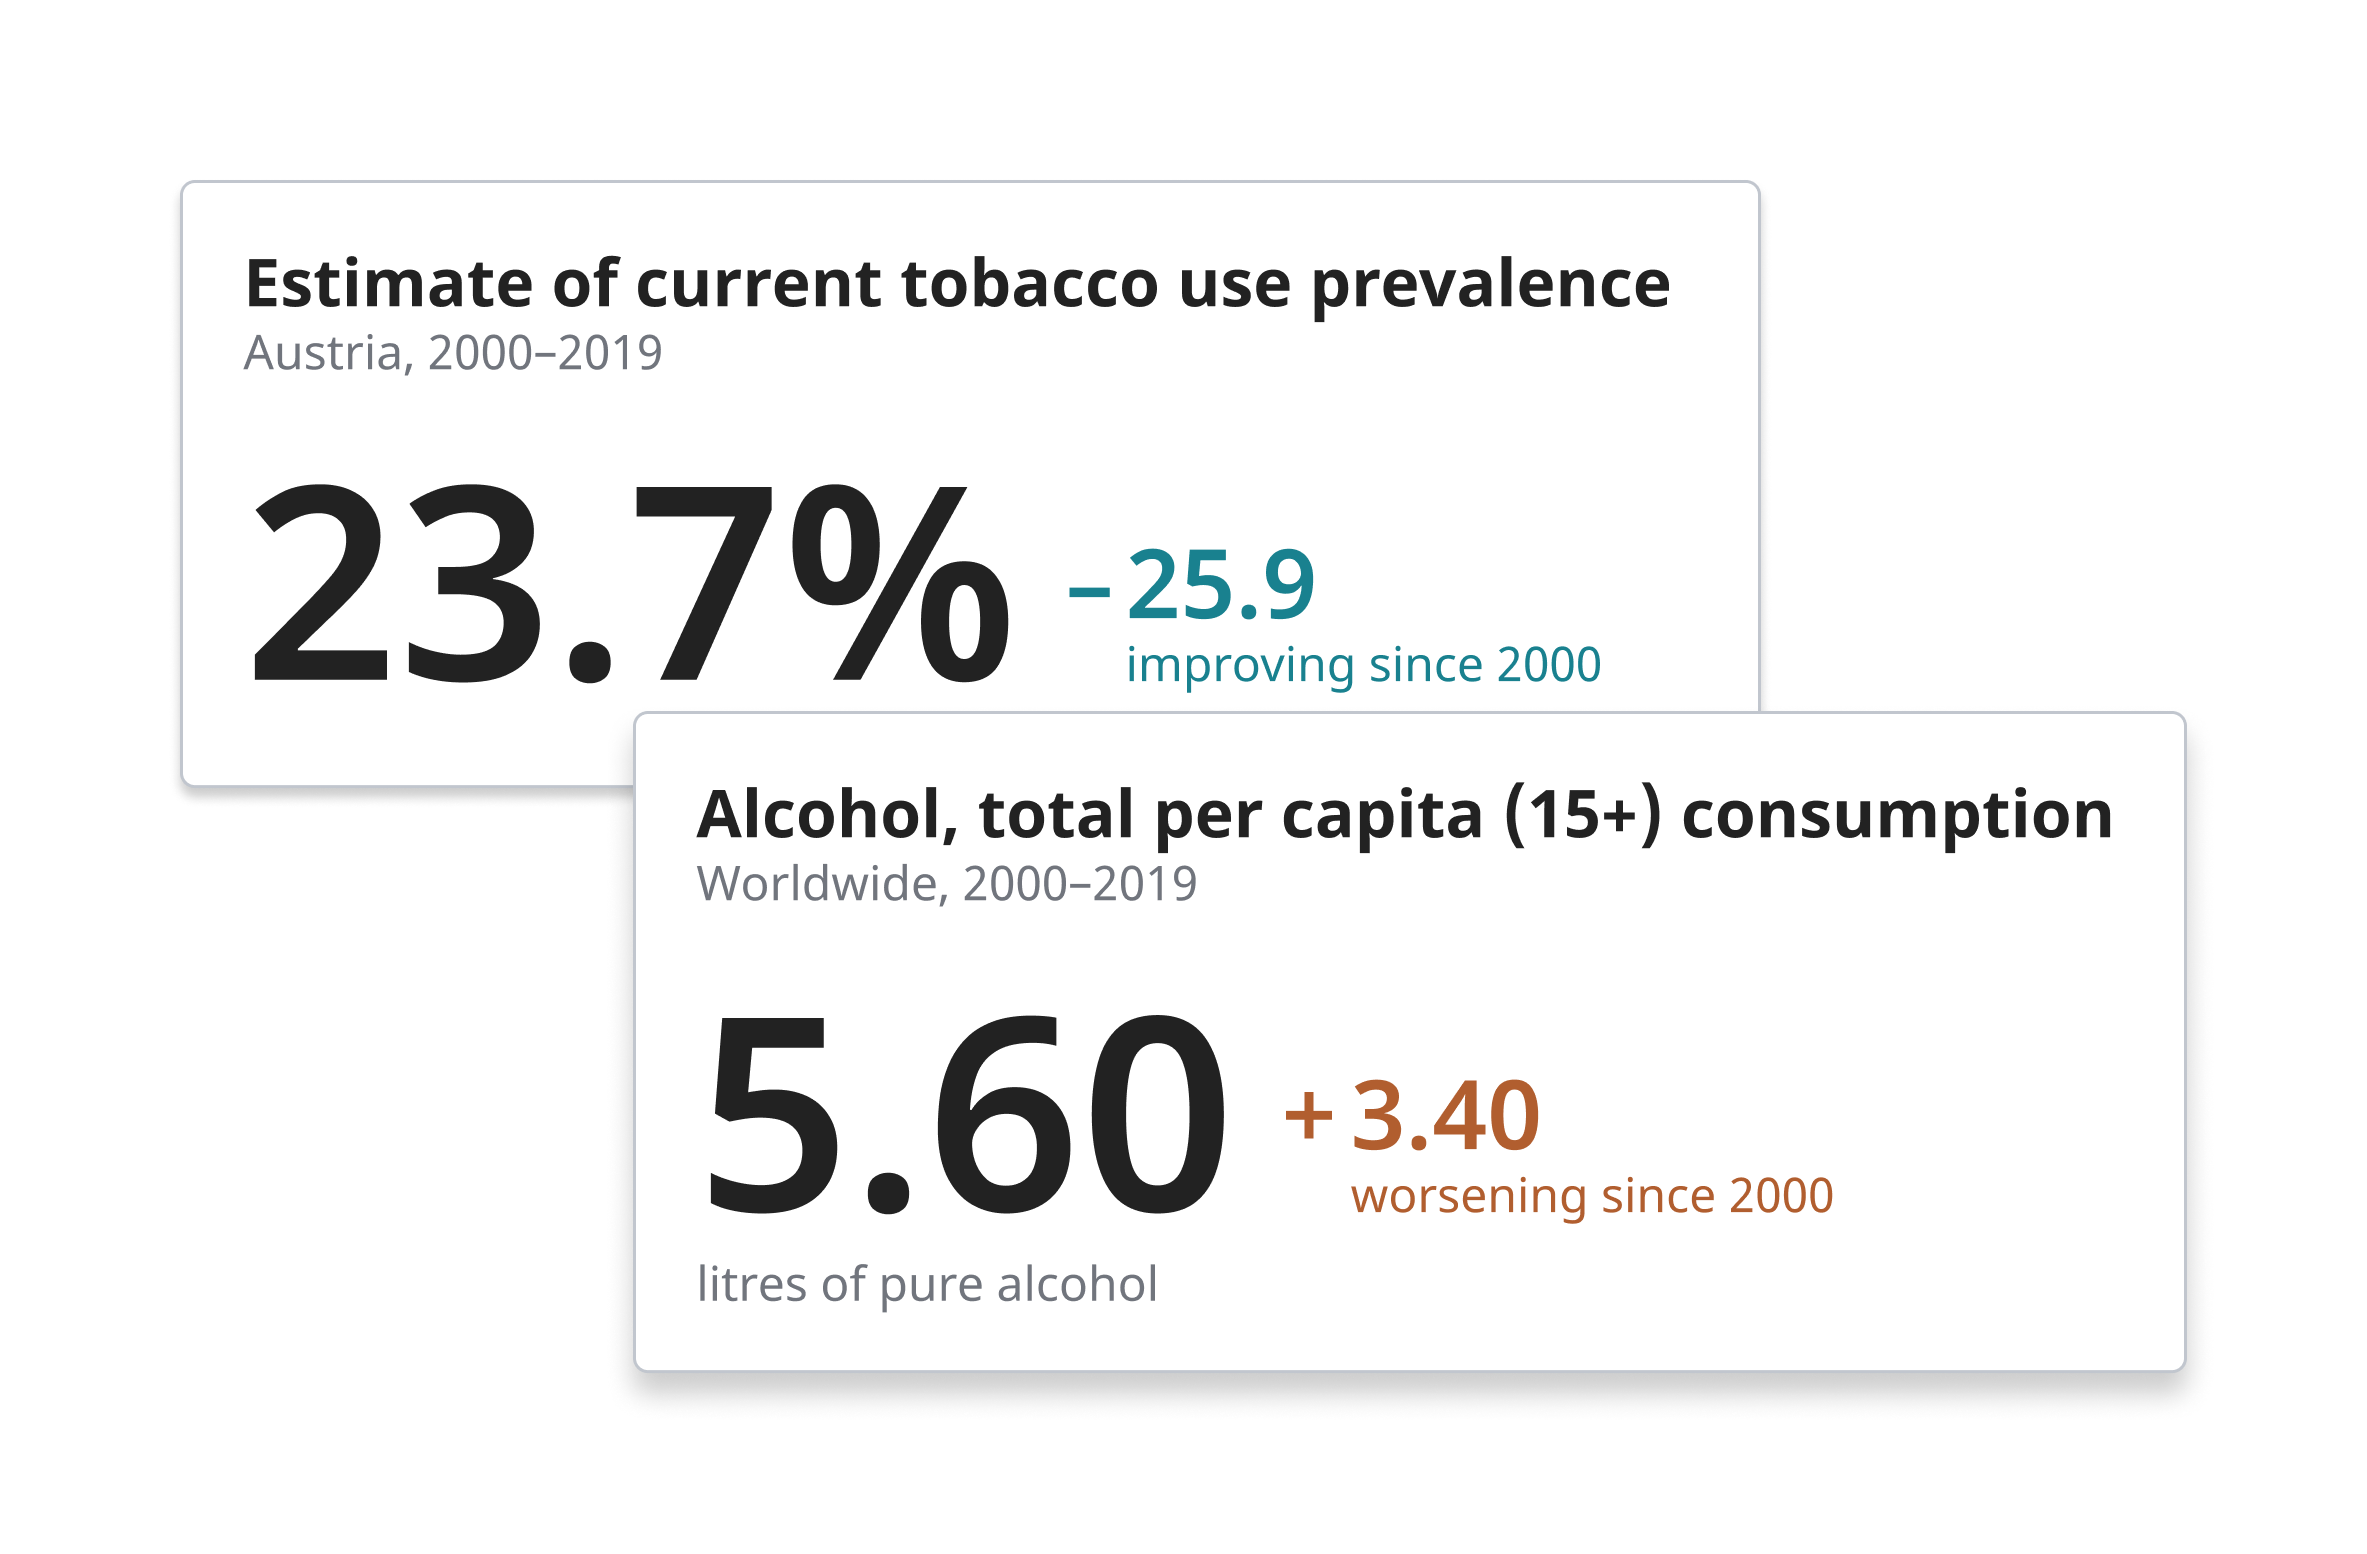
Appropriate degree of precision
Data representations show numbers only to a warranted degree of precision.