We optimize data perspectives to their specific usage context. This includes supporting charts and data aggregations that fit the user questions, data semantics and communication context.
Answer user questions
Based on user intent & communication purpose, the system facilitates picking the representation that most clearly answers the question at hand. This avoids complex charts to answer simple questions.
Optimal perspective for data semantics
The process of creating a data representation starts with the selection of datasets, dimensions, and filters. Based on the semantics of this data the most suitable representation is recommended.
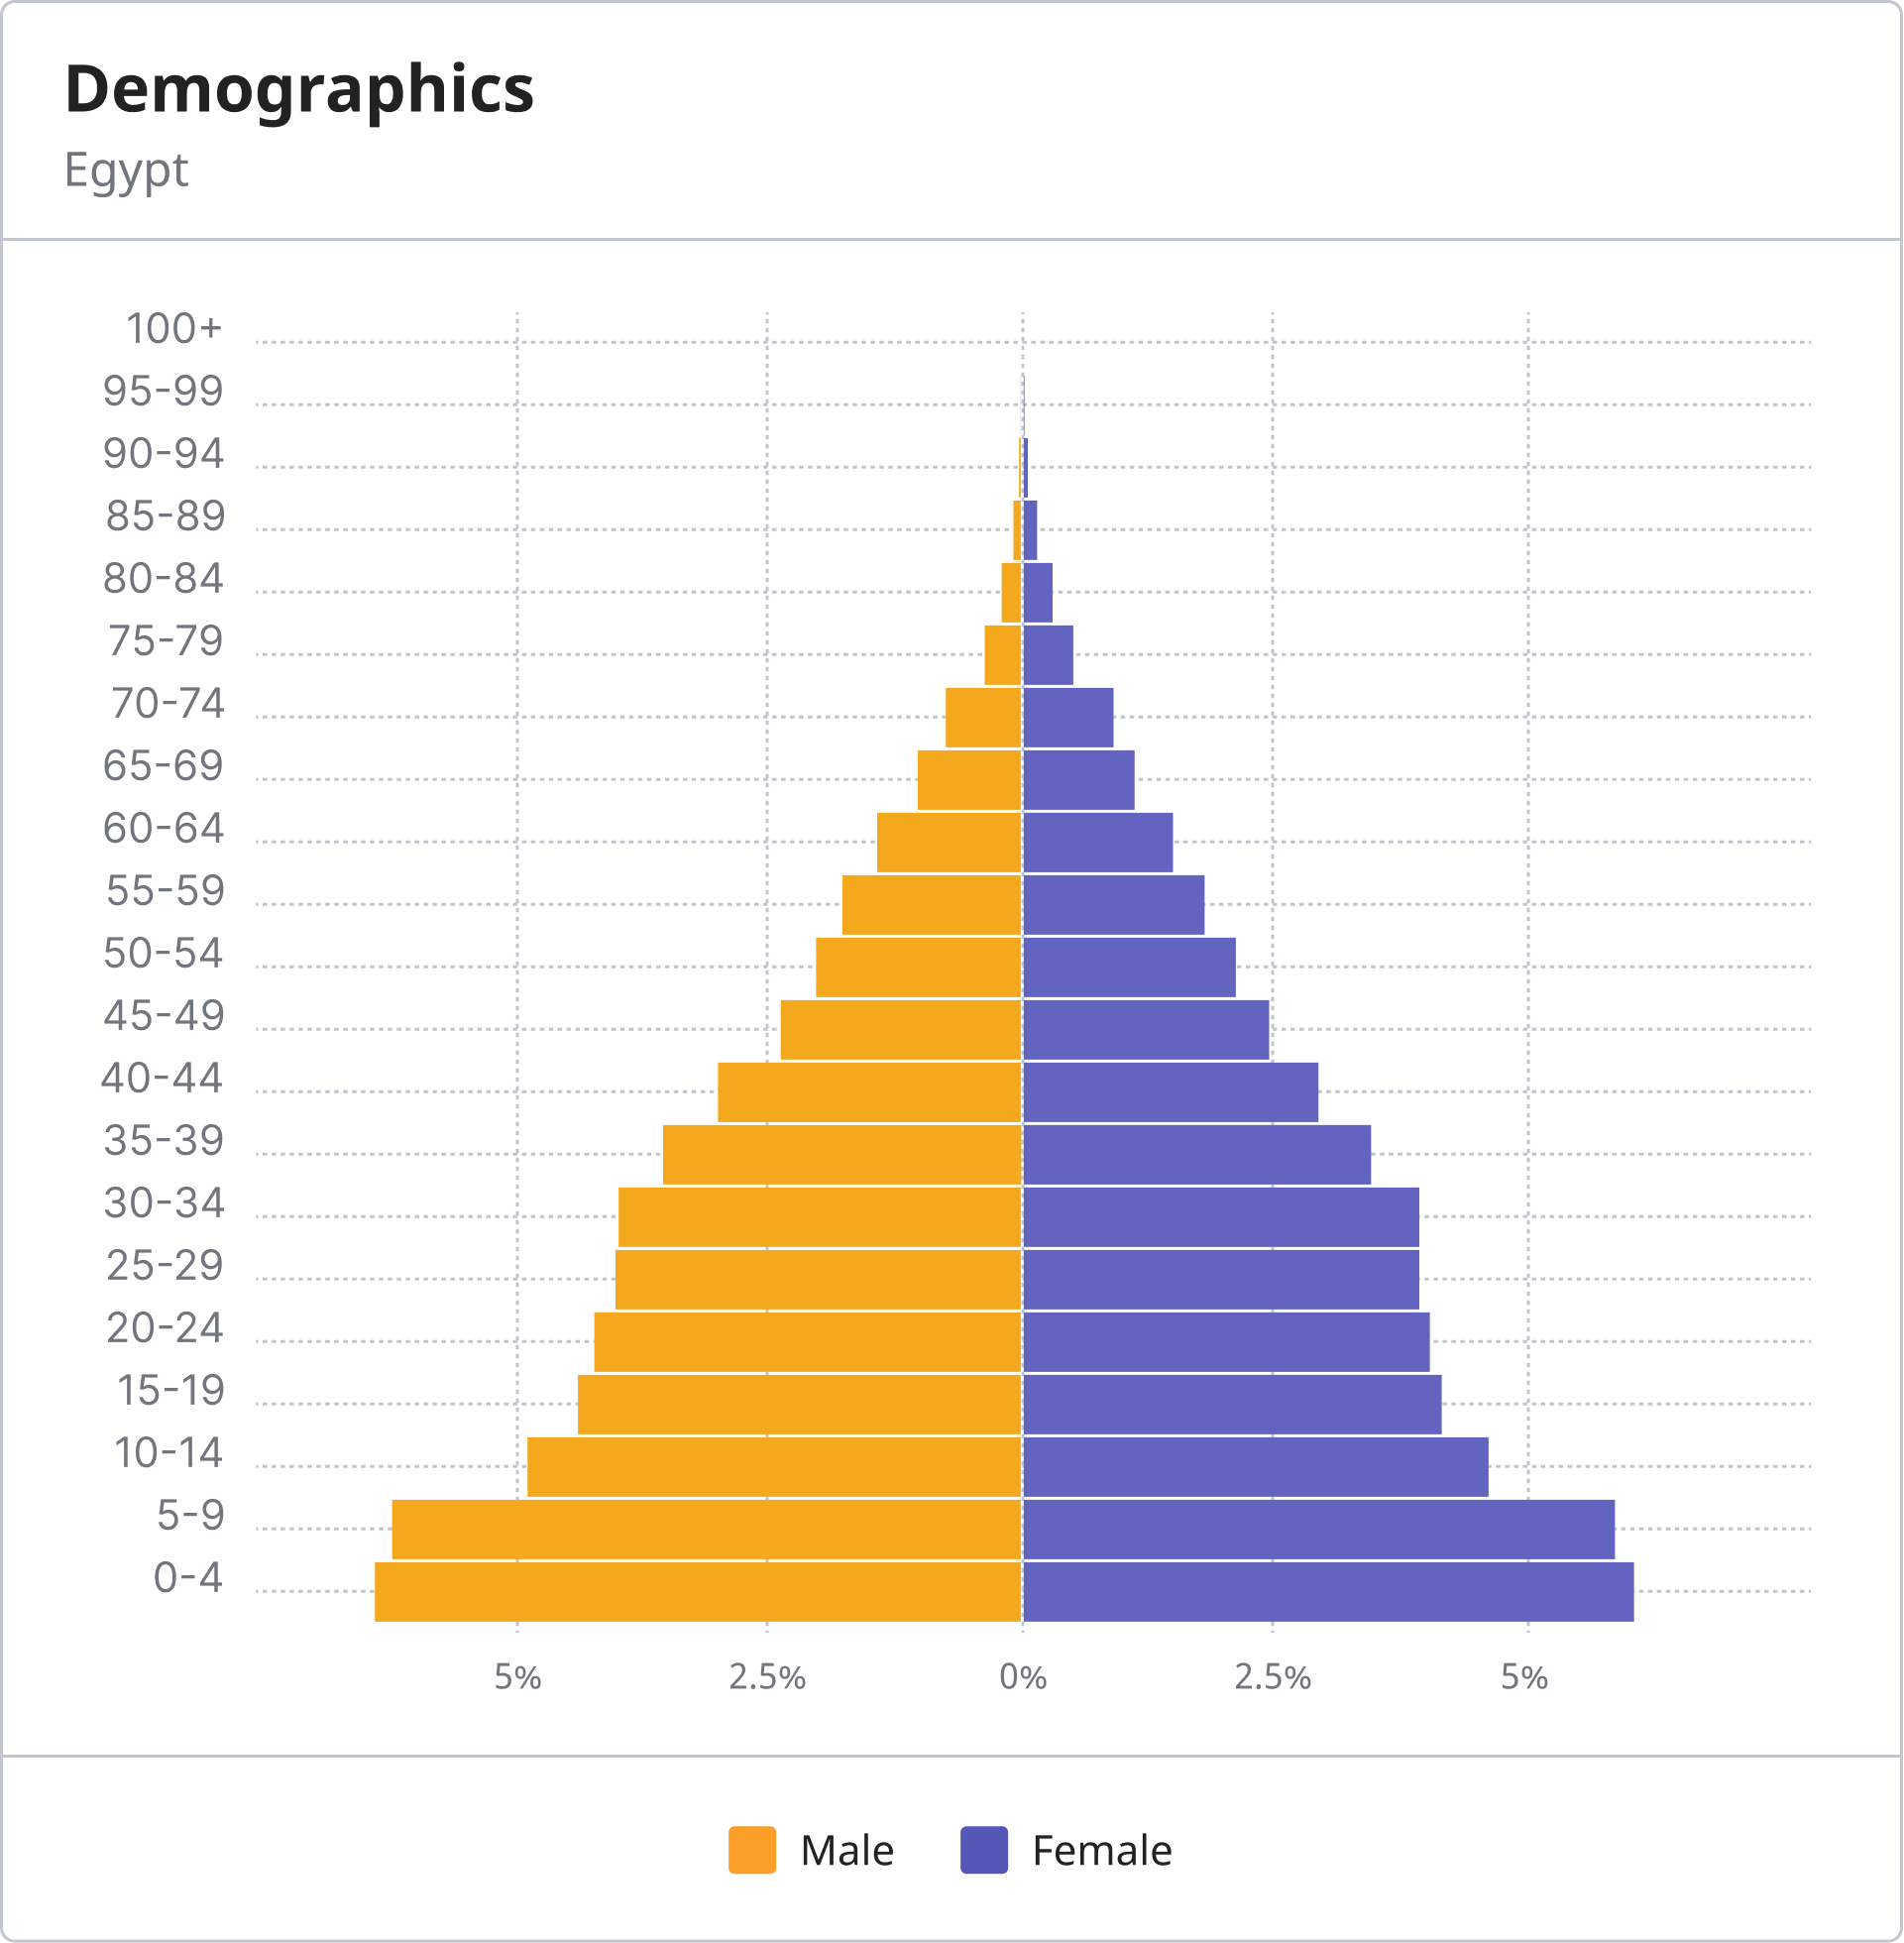
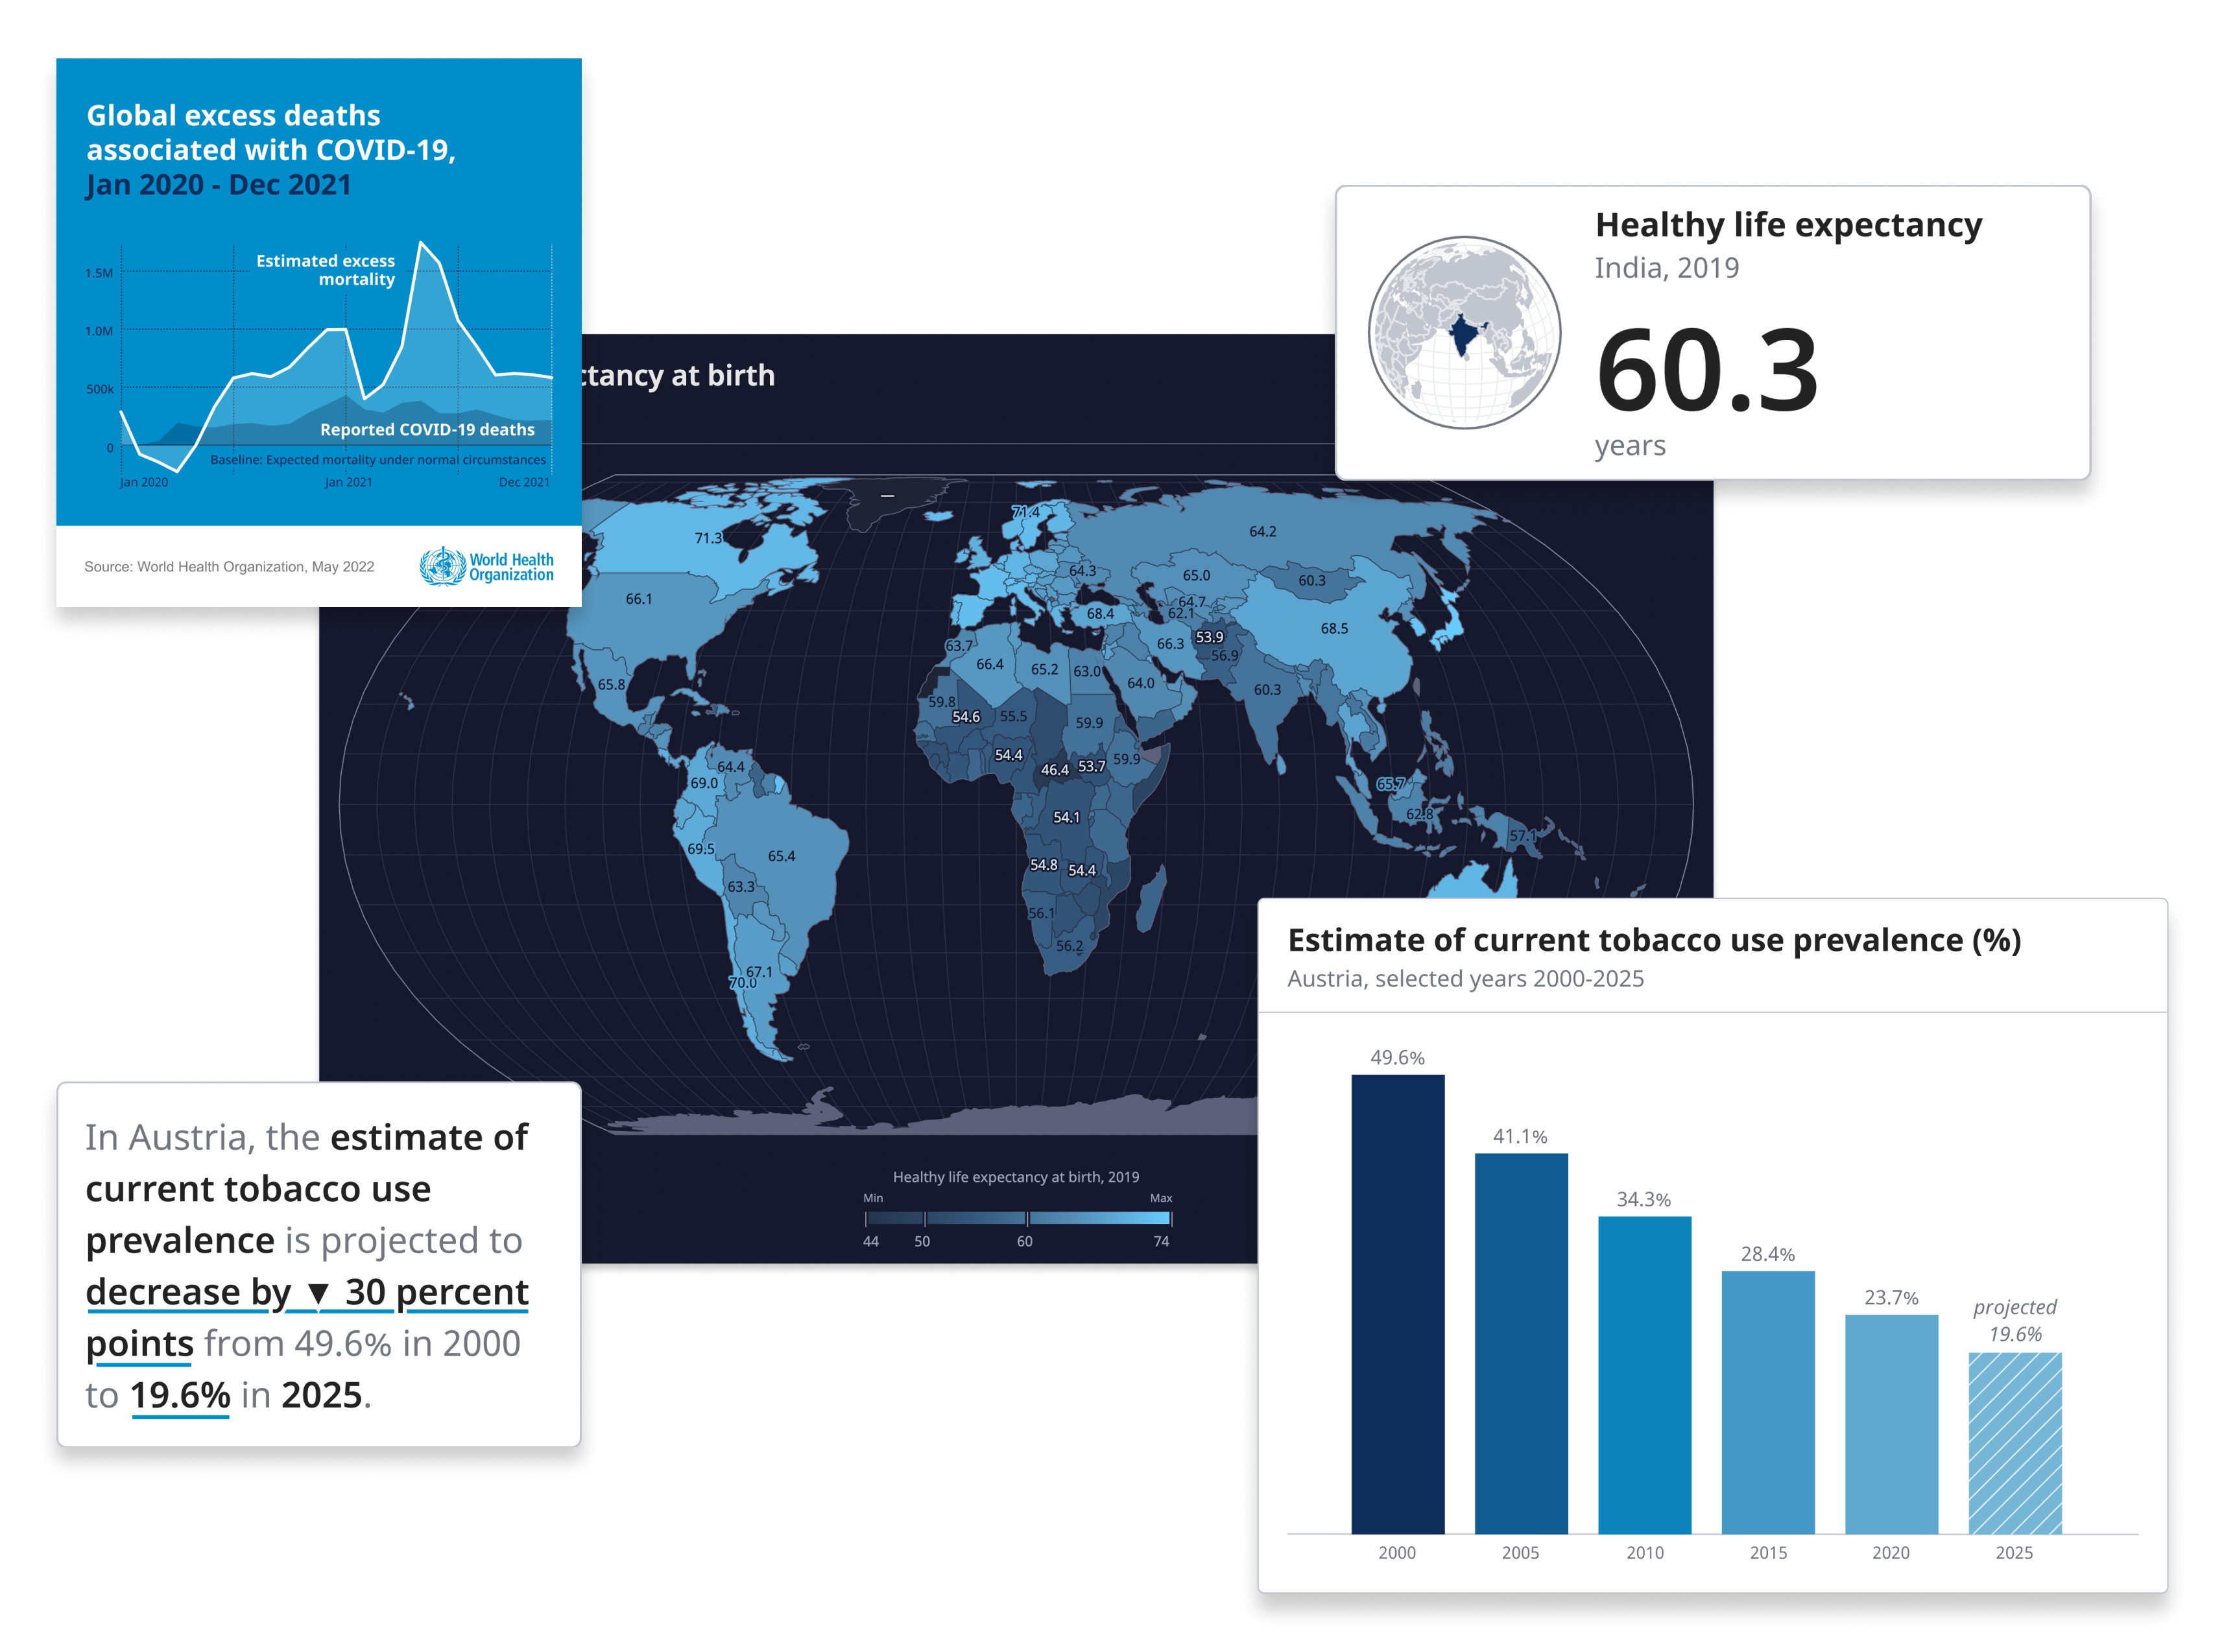
Domain specific representations & visual vocabulary
The visual vocabulary is focused on representations most suitable for the context of WHO health data (including data dimensions, value types & breakdowns) as well as communication contexts.
Optimal perspective for communication context
The data experience language supports a variety of communication contexts (e.g. web, print, auditory outputs, presentations, social media). Representations can be chosen and adapted to the medium and usage context at hand.